Brain scans explained and why brain injury cannot always be visualized
Introduction: Different types of scans
There are different types of scans. Scans with structural technique and scans with functional technique.
As the word suggests, the former technique mainly shows the structure and abnormalities of structure (anatomy) and the latter technique mainly shows the abnormalities in function (physiology).
If there are no structural abnormalities, there may be abnormalities in functioning, see paragraph non-abnormal scan.
People may have complaints and brain damage without a traditional scan such as MRI or CT/CAT being able to record it.
The structural and functional techniques can be complementary to each other.
Structural: MRI scan and CT or CAT scan
Functional: PET scan, SPECT scan, fMRI and MRE
Combinations: There are also combination scans such as FDG-PET/CT, PET-MR scan and PET-CT scan.
In addition to the topics mentioned above, this page provides information about the DTI scan and tests such as MEG, cobi DTI-MRE and Clarity.
Furthermore, we explain scanning techniques, the EEG and Quantum EEG (qEEG).
If a brain scan does not show injury, there may be injury
Non-abnormal scan?
A non-abnormal scan does not always mean that there is no injury, and vice versa. Additional research, for example a
neuropsychological examination
by an experienced neuropsychologist with clinical experience with people with brain injury and possibly a qEEG (quantum EEG) and investigating the medical history can be wise in doubtful cases.
The neurologist can also refer to an academic hospital where a blood flow scan or a combination scan can be made. These are expensive techniques and there must be a valid reason for the referral.
A blood flow scan emits more radiation and is on average 4x more expensive than an MRI scan and 10x more expensive than a CT scan.
We have to break the myth that all injuries are visible on a scan.
Structural techniques
There are scans that visualize brain structures (anatomy), such as CT scans and MRI scans. They show, for example, the size of the brain, its location, a space-occupying process and whether there are any abnormalities or (focal) scars visible.
Diffuse axonal lesions cannot or can hardly be visualized.
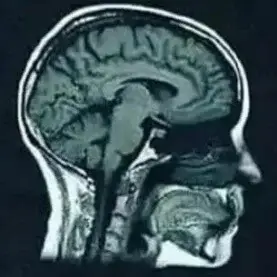
MRI scan (Magnetic Resonance Imaging) is a magnetic resonance scan. The MRI scan uses a magnetic field that is harmless, except if there are iron objects in the body or on the body. An MRI scan consists of a table on which the patient lies and a hollow cylindrical magnet. The cylinder is too frightening for many people and people who are seriously overweight do not fit in it. That is why MRIs are also made with two separate plates.

BY Fastfission on en.wikipedia (or de.wikipedia) - own work, CC BY-SA 3.0,
https://commons.wikimedia.org/w/index.php?curid=229995
An MRI scan can show how many hydrogen nuclei are in one area. Each type of tissue has different hydrogen densities and thus details of the anatomy can be observed. A three-dimensional image is formed from the measurements.
An MRI scan can observe the brain structure, location, size, space-occupying processes, (brain tumors and inflammations) abnormalities of healthy tissue and scars (focal damage). An MRI scan cannot show axonal damage or diffuse axonal damage, or the latter with great difficulty as a white matter abnormality.
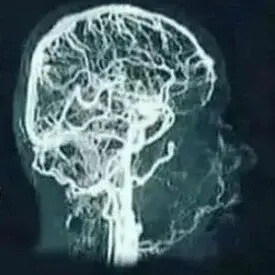
An MRA scan is a picture of the blood vessels, in this case the cerebral blood vessels.
MRA stands for Magnetic Resonance Angiography.
It is a combination of angiography (X-ray examination of blood vessels) and an MRI scan (powerful magnetic field and radio frequency waves).
Sometimes a contrast fluid is injected into the blood vessels so that they become clearly visible during the scan.
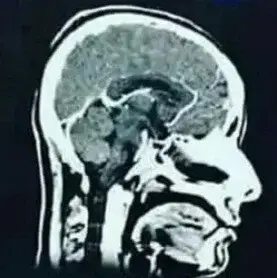
A CT scan (Computer Tomography), also called CAT scan (Computerized Axial Tomography) measures the absorption of X-rays and emits ionizing radiation.
This is the same as the X-rays from an X-ray machine.
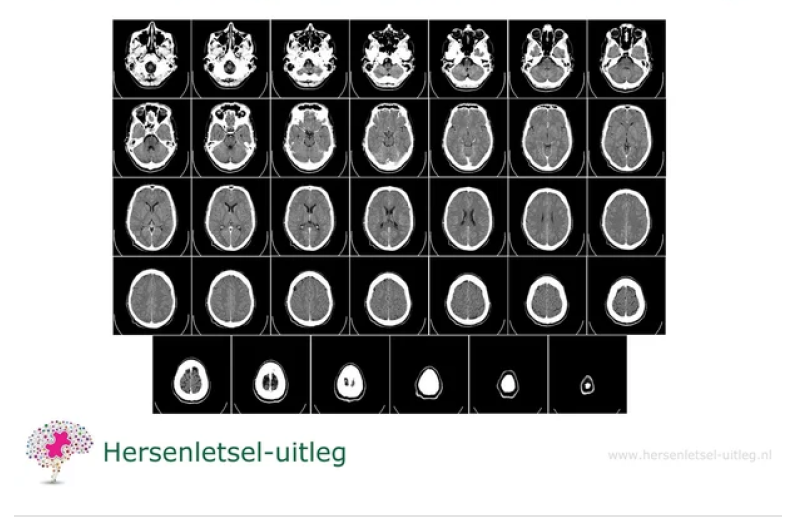
A CT scan creates images of cross-sections of the body; it looks as if the organ is being photographed in slices. It photographs from different angles and combines all the images into a three-dimensional image.
It can detect brain structure, location, size and scars (focal damage) and structural abnormalities. It cannot visualize diffuse axonal damage. It can visualize dead brain tissue in a cerebral haemorrhage or cerebral infarction (not always) or a tumor, hydrocephalus or even forms of dementia.
There is a special CT scan for cerebral arteries: CTA scan, which can quickly detect a cerebral infarction so that there is a better prognosis (chance) of recovery. It must then concern a clot that is in one of the large arteries. This is the case in 10% of cerebral infarctions.
Functional techniques
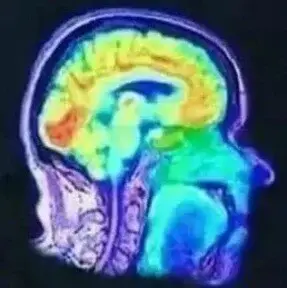
A blood flow scan, PET scan (Positron Emission Tomography)
or SPECT scan (Single Photon Emission Computed Tomography) shows the functioning, for example whether there is a blood flow disorder or increased activity. It therefore detects changes in blood flow and metabolism in the brain. Diffuse injury can often be made visible with this, but not always.
It is also an extremely expensive technique.
Very specific urgent medical reasons are needed to use these expensive techniques, which are also not available in all hospitals. The neurologist will have to decide each time in which rare situations someone should be referred to use these techniques.
The PET scan uses small amounts of radioactive materials called radiotracers, a special camera and a computer to assess organ and tissue function. By identifying changes in the body at a cellular (neural) level, the PET scan can detect abnormalities or disease before it becomes apparent in other imaging tests.
It not only measures blood flow, but also sugar metabolism (glucose metabolism) and oxygen uptake. The injected radioactive substance disappears quickly from the body and is not harmful. Diffuse injuries can sometimes be visualized better than with an MRI scan. If there is any doubt about a diagnosis, this scan may sometimes provide the answer. However, the use of this technique requires an urgent medical situation. It is not intended to provide evidence of injuries sustained in the past.
The SPECT scan also uses small amounts of radioactive materials that accumulate in certain tissues or organs so that an image can be made of them. The radioactive materials disappear quickly from the body and are not harmful.
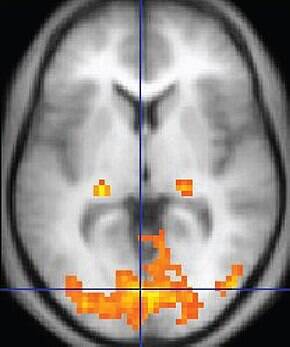
Functional MRI scan (fMRI scan, functional magnetic resonance imaging) measures changes in blood flow in the area under examination (at the neural level) and investigates complex task performance, but it is debatable whether it can diagnose conditions such as perception and motor skills, but also higher cognitive functions such as memory, language or consciousness.
Scientists have not yet determined which function is located where, because there are differences between people and control groups did not always provide a definitive answer.
Researchers from Duke University’s Laboratory of NeuroGenetics analyzed data from 56 studies based on fMRI scans. They saw that the brain of a certain person reacts differently each time to the same task or when seeing an image. ‘The connection between the first scan and the second (four months later) is very weak’, says researcher Ahmad Hariri from Duke University. fMRI is not yet suitable for diagnoses. Only for language tasks is there a ‘reasonable’ similarity between how the brain of the test subject reacts one time and the other.
Professor applied cognitive neuroscience Alexander Sack of Maastricht University says that the reliability of fMRI scans has long been a topic of discussion in small circles when it comes to statements about an individual.
The theory is that if someone uses a certain brain area, that area will be better supplied with blood and more oxygen will be used from the hemoglobin. This is simultaneously determined by the fMRI detectors. With the fMRI it can be investigated which brain areas work together (functional connectivity).
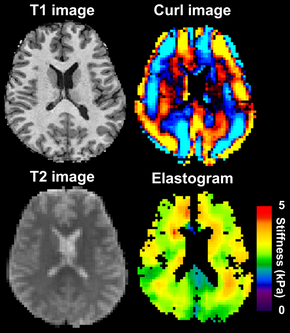
MRE (Magnetic Resonance Elastography) is a technology that combines MRI imaging with low-frequency vibrations to create a visual map (elastogram) that shows the elasticity or stiffness of body tissues. It can help speed up early diagnosis.
Changes in tissue stiffness are known to be associated with various disorders, such as cerebral tumors, Alzheimer's disease and Multiple Sclerosis (MS), making MRE a valuable tool in detecting and monitoring these diseases.
Combination technique

An FDG-PET/CT scan is a combination of the PET scan (positron emission tomography) that measures blood flow and a CT scan that examines structures.
By administering a harmless radioactive sugar, 18F-FDG or fluorine-18-FDG, local glucose metabolism and cell division can be visualized.
This scan is usually used to detect infections and tumors because sugar metabolism is increased in these conditions. The harmless substance FDG is simply urinated out within a few hours.

A PET-MR scan is a combination of PET scan (Positron Emission Tomography) that measures blood flow or activity and MR (Magnetic Resonance). The time effect of medication can also be measured accurately with this technique. This scan also uses harmless radioactively labeled sugar.
There is less radiation exposure than with a PET/CT scan. The images of the PET scan are superimposed on the MRI images to arrive at an accurate diagnosis.
Unfortunately, there are few hospitals that offer a PET/MR scan. The use of this technique requires an urgent medical situation. It is not suitable for providing evidence of injuries sustained in the past.

A PET/CT scan is a combination of a PET scan and a CT scan in one device. The CT scanner uses X-rays to provide information about the structure of tissues.
A PET scan (Positron Emission Tomography) provides an image of the metabolism of tissues. A tracer is used, a radioactive substance that is absorbed by the body and later excreted in urine.
A PET-CT scan is not only used to detect tumors. Reduced blood flow or inflammation can also be seen.
People with memory disorders where the cause cannot be determined can undergo an Alzheimer's test with this scanner. This allows an estimate to be made of whether someone may develop Alzheimer's disease within a period of 10 years.
Read more about the advantages of a PET/CT scan here.
It is crucial to recognize that techniques differ in what they measure.
For example, fMRI and PET measurements provide information about brain metabolism: how much energy is used by a particular part of the brain, indicated by changes in oxygen (fMRI, PET) or glucose (PET) levels.
Information about brain metabolism can be used as an indirect indicator of local neuronal activity.
Advances in technology
DTI scan Diffusion Tensor Imaging scan.
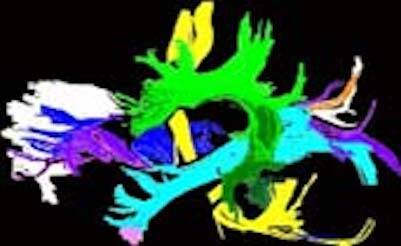
The DTI scan is based on MRI. It can visualize neural connections of the brain.
The advances in MRI techniques follow each other rapidly and some MRI centers are now able to show evidence on an MRI of diffuse axonal lesions. Evidence of correlative petechial hemorrhages with a relatively new MRI technique: Diffusion Tensor Imaging (DTI).
This MRI looks at the quality of the white matter, which forms the connection between the different brain areas, diffuse axonal injury and thus looks at damage to the microstructure.
As the software improves to interpret the digital data from the newer, more powerful MRI magnets, a large percentage of concussions, for example, which are now difficult to diagnose (objectively), will show demonstrable MRI abnormalities.
Additional research
Magneto-Electro-Encephalography (MEG) is a combination research without causing any discomfort to the patient. MEG measures magnetic fields and EEG (electro-encephalography) measures the electrical activity of the brain.
A special helmet is used around the head on which the MEG sensors are placed. The face remains free so someone can see or listen to music during the research. The test takes about an hour with several short breaks. There is no loud noise during the test. The environment of MEG is quiet.
This research has previously been used to visualize a concussion.
MEG is then used simultaneously with a machine that performs analyses based on algorithms.
The MEG is not a scan but a brain film that measures the electrical activity of the brain. In concussions, a reduced network "connectivity" of certain brain waves was seen. The connectivity is a connection or integration. In particular, there were changes in the delta and gamma frequency range (> 30 Hz), together with increased connectivity in the slower alpha band (8-12 Hz). Read the English original text here from
www.journals.plos.org.
Read here the information about the possibilities of following eye movements to diagnose a concussion here.
DTI-MRE is a combination of diffusion tensor imaging (DTI) and 3D- vector field data magnetic resonance elastography (MRE).
This scan is able to determine tissue stiffness and diffusion properties. Changes in tissue stiffness are known to be associated with various disorders, such as brain tumors, Alzheimer's disease and Multiple Sclerosis (MS), making MRE a valuable tool in the detection and monitoring of these diseases.

Clarity
The Clarity technique can be used to visualize brain tissue transparently by means of chemical changes. At the moment, this is only possible with dead brain tissue, because the chemical changes can damage the living brain.
Clarity can be used to visualize nerve pathways. The image shows nerve cells in green. The brain can then be further examined by combining optical and molecular techniques.
In the animation below (*not a real brain), researchers have placed information about the brain of a seven-year-old boy with autism in a video. See also a Wikipedia page about Clarity.

EEG brain film
An Electroencephalogram (EEG) examines the electrical activity of the brain. Brain cells (neurons) send out weak electrical signals. The brain is constantly active.
Even when a person is asleep, the brain cells send signals to other brain cells.
A reliable and not painful method for the patient to record this electrical activity is a brain film, or electroencephalography (EEG).
Performing an EEG
Electrodes are attached to the scalp using adhesives with a conductive contact paste. An electrode cap is usually used. This is a kind of bathing cap with holes. The examination is painless and usually takes an hour to an hour and a half. A 24-hour EEG is used to monitor brain activity over a longer period of time. In acute situations, a bedside EEG can be performed with a single electrode.
It is also possible to take an EEG via the ear (ear EEG), in which the electrical signals of the brain are measured via a plug in the ear.
During an EEG examination, the differences in brain activity are examined, when the patient has the eyes open or closed, when someone sighs deeply for a few minutes, or when flashes of light are shown while the eyes are closed.
Diagnosis
An EEG is a method to examine brain function in the various brain areas, and thus to find out the cause of the complaints.
An EEG can therefore be valuable to demonstrate functional disorders, when there is clearly a reduced brain function, but where structural imaging is normal.
An EEG is most often used to diagnose epilepsy, sleep disorders, or forms of encephalopathy, delirium or a degenerative disorder, such as dementia.
An EEG can show all kinds of symptoms, such as a brain tumor or other space-occupying processes, encephalitis, Creutzfeldt-Jakob disease (CJD), fever attacks, tremors, a hepatic coma (a coma caused by a failing liver) and hormonal changes such as Hashimoto's disease. It can show an overdose or the severity of a coma, as well as determine brain death. After resuscitation after cardiac arrest, an EEG can provide information about the prognosis.
Because a blood sugar level that is too low affects the EEG, a patient must not be fasting during the examination.
An organic brain disorder cannot be ruled out with a normal EEG, and conversely, an abnormal EEG does not always mean that there is an organic brain disorder.
An improvement in the EEG does not always say anything about an improvement in the patient's condition.
Speed of waves: Frequency in Hz
An EEG is displayed in a graph, in which slow and fast waves or number of vibrations per second are visible. The speed (frequency) of the waves is indicated internationally in Hertz (Hz). 1 Hz corresponds to one vibration per 1 second.
The names of the waves are related to the speed: alpha (8 to 12 Hz), beta (13 to 30 Hz), theta (4 to 7 Hz), delta (less than 4 Hz) and gamma (38 to 80 Hz).
There are more waves such as the Mu (7-11 Hz). These waves are measured specifically in the motor cortex (above the right central region), during physical rest, for example when thinking about movement, willingness to move or tactile stimulation.
Peaks or flat waves: Amplitude in microvolts
The wave (amplitude or oscillation) can show a high peak or be flattened, and is measured in microvolts (μV). A microvolt is one millionth of a volt. The amplitudes vary between 20 and 100 microvolts (μV), with peaks up to 125 microvolts (μV). If less than 10 microvolts are measured and longer than half the time, there is a suppression pattern (burst suppression).
Example
Look in the image below at the higher (in microvolts) and longer lasting (in milliseconds) waves for RF (right frontal) and RT (right temporal) in the graph on the right.
An EEG of an elderly man with right-sided headache, vomiting and paralysis in the left hemisphere
The EEG shows a delay in alpha activity over the right hemisphere and 1-2 Hz activity over the right frontotemporal area. It appeared to be a space-occupying process.
F=Frontal C=Central T=Temporal P=Parietal O=Occipital
L=Left R=Right
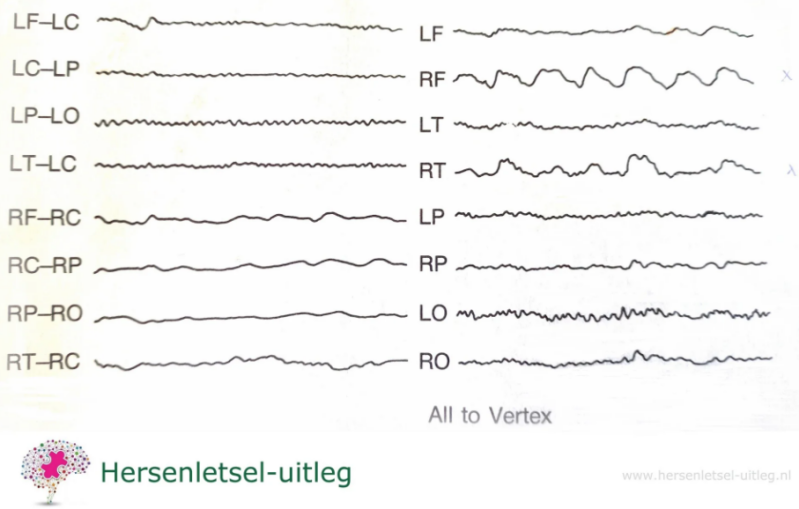
Explanation on brain waves


An altered EEG
EEG changes can be broadly classified into epileptiform and non-epileptiform activity, so related to epilepsy or not. They can also be classified as focal or diffuse. Focal means localized in a brain area and diffuse means spread throughout the brain.
A slowed down EEG
Slow activity on the EEG means frequencies that are lower than the alpha rhythm, i.e. theta and delta waves. Theta and delta waves are not observed when a person is awake, unless there is a reduced functioning of the brain, or during meditation.
A slowed EEG is seen in Lewy Body dementia (often a severe diffuse (widespread) slowing) and in Alzheimer's disease (less severe slowing). In the early stages, with mild cognitive impairment, the EEG is usually normal. As the disease progresses, the alpha rhythm slows down and then disappears, and in a moderately or severely demented patient the EEG shows slow activity.
In babies, a slow EEG is normal.
If a general slowing (generalized slowing) is seen diffusely spread over the brain, this often indicates diffuse encephalopathies, regardless of the cause. The more severe the clinical picture, the more severe the slowing.
Delays in specific areas
With ADHD and often also with PTSD, very slow waves can be seen in the (pre) frontal brain areas. Waves in the frontal lobes that are slower than normal can indicate impulsiveness, where the rational brain has little control over the emotional brain.
Although, and by no means in everyone, with PTSD an increased activity in the (particularly right) temporal lobe can be seen.
An increased delta rhythm
An increased delta rhythm during waking hours can indicate brain tumors.
Epilepsy spikes
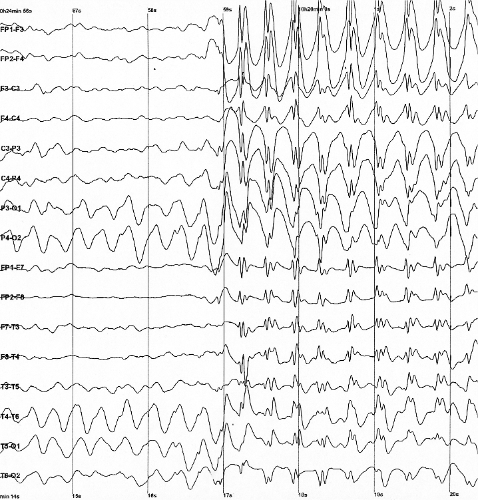
During an epileptic seizure, abnormal electrical discharges (epilepsy waves and epileptiform abnormalities) are seen on the EEG. The sharp waves (neural firing) are the so-called
spikes.
The neural inhibition waves are sharp waves. The spikes last briefly: 20 to less than 70 milliseconds (ms). The amplitude varies but is less than 50 microvolts (μV).
Spikes and waves
Another pattern is a spike-and-wave complex. In people with a 'petit mal' or absence epileptic seizure, the spike-and-wave discharges are seen more often. A regular, symmetrical pattern consisting of a (single or multiple) spike and an accompanying slow wave. An absence is characterized by someone seeming absent for a moment. The person stops what he or she was doing, stares, taps his or her head, or sometimes fidgets a bit.
An absence can last 3- 30 seconds.
qEEG / Quantum EEG
QEEG or qEEG stands for quantitative EEG (quantum EEG).
It is a technique to quickly recognize abnormal brain waves by means of a computerized EEG analysis, and to compare them with a large group of people.
A qEEG is also called 'brain mapping' or quantitative electroencephalogram.
It only measures the electrical activity in the cerebral cortex and not that of the deeper (subcortical) brain areas. (See the paragraph above about EEG).
It can be a quick way to show a cortical (cerebral cortex) dysfunction, but that does not have to be specific for injury.
Many behavioral problems and other mental problems can already show abnormalities on a qEEG.
It is also used for this in neurofeedback therapy forms such as for impulsiveness, depression and anxiety disorders.
In the Netherlands a qEEG is not a legal method to make a diagnosis, if someone other than a specialized doctor makes the analyses. Others, such as neuropsychologists or neuroscientists, are not legally authorized to make medical diagnoses.
A qEEG is also not suitable for diagnosing a psychiatric picture, for a formal DSM diagnosis.
In that case, an additional psychological/psychiatric examination is required.
Advantages of MRI imaging over CT with respect to neuroimaging
- MRI provides more detail in soft tissues
- MRI can change contrast (small change in radio waves)
- MRI can rotate, so without moving the patient you can make images in any plane
- However, CT is faster and cheaper.
Which imaging techniques are used to visualize the brain and spinal cord?
- CT, MRI, PET scan, fMRI
- fMRI records activity level (but also anatomy). MRI records anatomy.
- fMRI is good for regions with a lot of blood which says something about the level of activity, but does not seem to be suitable for individual diagnoses yet (June 2020).
- Let's hope that science advances, because not only can we not visualize all brain injuries, but we also know so very little about brain injuries.
Even with a detailed scan, some damage remains invisible. That does not mean that those people who continue to have complaints are being pretentious. - There is no one-to-one relationship between the complaints someone has and the visibility of the damage on the scan.
Resources
Hersenletsel-uitleg, team Hersenletsel+uitleg 2015
Elliott, M.L. and Knodt, A.R. et al. (2020) What Is the Test-Retest Reliability of Common Task-Functional MRI Measures? New Empirical Evidence anda Meta-Analysis. Psychological Science, https://doi/10.1177/0956797620916786
Kandel, E.R, Koester,J. , Mack, S., Siegelbaum, S. Principles of neural science (6th ed.). New York. 2021. p. 1450. ISBN 978-1-259-64223-4.OCLC 1199587061.
Kane N, Acharya J, Benickzy S, Caboclo L, Finnigan S, Kaplan PW, Shibasaki H, Pressler R, van Putten MJAM. A revised glossary of terms mostcommonly used by clinical electroencephalographers and updated proposal for the report format of the EEG findings. Revision 2017. ClinNeurophysiol Pract. 2017;2:170-185. [PMC free article] [PubMed] Looney D, Kidmose P, Park C, Ungstrup M, Rank ML, Rosenkranz M, & Mandic DP(2012). Ear-EEG: User-Centred and Wearable Brain Monitoring. IEEE Pulse Magazine.Karameh FN, Dahleh MA. Automated classification of EEG signals in brain tumor diagnostics. Proceedings of the American Control Conference.Chicago, Illinois. 2000:1-5.
Niedermeyer, E & Lopes da Silva, FH, Electroencephalography : basic principles, clinical applications, and related fields, Philadelphia (2004). ISBN0781751268.Roohi-Azizi M, Azimi L, Heysieattalab S, Aamidfar M. Changes of the brain's bioelectrical activity in cognition, consciousness, and some mentaldisorders. Med J Islam Repub Iran. 2017 Sep 3;31:53. doi: 10.14196/mjiri.31.53. PMID: 29445682; PMCID: PMC5804435.Sazgar, M., Young, M.G. (2019). Normal EEG Awake and Sleep. In: Absolute Epilepsy and EEG Rotation Review. Springer, Cham.https://doi.org/10.1007/978-3-030-03511-2_6https://link.springer.com/chapter/10.1007/978-3-030-03511-2_6
Smith SJM EEG in neurological conditions other than epilepsy: when does it help, what does it add? Journal of Neurology, Neurosurgery & Psychiatry2005;76:ii8-ii12.
Tatum, WO, Handbook of EEG interpretation, New York (2014). ISBN 9781617051807
Tatum WO, Olga S, Ochoa JG, Munger Clary H, Cheek J, Drislane F, Tsuchida TN. American Clinical Neurophysiology Society Guideline 7: Guidelinesfor EEG Reporting. J Clin Neurophysiol. 2016 Aug;33(4):328-32. [PubMed] [Reference list]
